Every year the Data Visualization Society considers hundreds of entries to select its Information Is Beautiful Awards Shortlist winners. This year’s honorees include some fascinating entries such as an illustrated explanation of Russia’s deportation of Ukrainians, a digital double infopoem “reflecting on the insanely specific and biased inferences algorithms make about us,” and a graphic of plastic bag usage at UK supermarkets over a five year period.
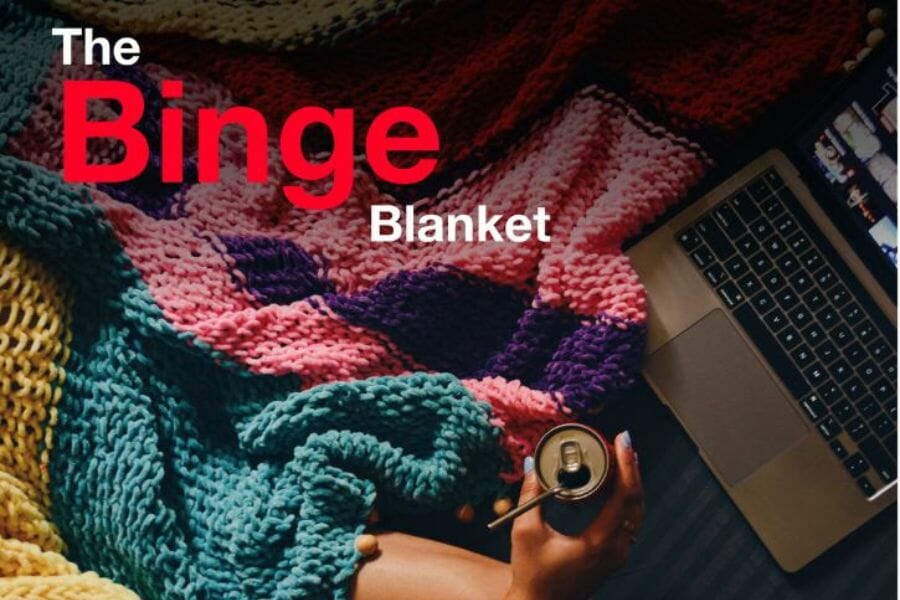
Several projects took personal screen time or streaming entertainment data and chose to visualize that in some unusual ways. The Binge Blanket, for example, is a hand-woven piece where “each thread of the yarn depicts an hour of the binge from a day in 2021 and the colour depicts the genre of the media viewed.” Altogether the projects showcase not only how graphics can help us spotlight data that matters most, but also how visualized information can help us better understand ourselves.

